Part B · The screens
B.16Observe
Everything the system does, as it happens: syncs, AI calls, decisions, writes to Nutshell, approvals and e-mails. Any step opens its full trace, so nothing the AI does is a black box.
- No.
- B.16
- Dashboard address
- /observe
What you can do here
Each core task, and how many clicks it takes from this screen.
| Task | Clicks | How |
|---|---|---|
| Watch what's happening now | 1 | Observe: the activity stream updates live; pause it to read. |
| Open the trace behind any event | 2 | Observe → Trace on the event: every step in order, the model call with its prompt and output, the rule decision with its reasons. |
| See every AI call with its cost | 2 | Observe → AI calls: model, tokens, cost and time per call; a row opens the prompt and the answer. |
| Check the system's health | 2 | Observe → Health: one tile per part, in words; a paused kill switch turns its tile amber. |
How it works behind the scenes
- Every service writes its steps with one trace id, so a website-chat reply, for example, reads end to end: the visitor's message, the tools the AI called, the model call, the claims check and the reply.
- Model calls are logged by the AI gateway with the model, the prompt version, tokens, cost and time. The prompt and answer are stored encrypted; text from visitors is marked as untrusted.
- Routine noise (bursts of reads, sync ticks) is grouped and hidden by default; one click shows everything.
Rules and switches that apply here
- Observe is read-only; it never changes anything.
- What a model was given and returned is shown in words; the raw record is available collapsed, never as the default view.
The tables behind it
PK primary keyFK reference the database enforces (solid line)ID reference kept by id (dashed line)
| Table | What it holds | Columns |
|---|---|---|
| ops.llm_calls | Every model call: who called it, the model, prompt version, tokens, cost and latency. | 37 |
| ctrl.decision_log | Every rule decision: the action, the result, the reasons and what could make it wrong. | 28 |
| ops.sync_runs | Each sync with Nutshell: when, what changed, and any drift found. | 9 |
How the tables connect (7)
| Column | Points to | Kept by |
|---|---|---|
| ops.llm_calls.agent_version_id | agent.agent_versions | The application (by id) |
| ops.llm_calls.run_id | agent.runs | The application (by id) |
| ops.llm_calls.conversation_id | conv.conversations | The application (by id) |
| ops.llm_calls.decision_id | ctrl.decision_log | The application (by id) |
| ctrl.decision_log.agent_version_id | agent.agent_versions | The application (by id) |
| ctrl.decision_log.run_id | agent.runs | The application (by id) |
| ctrl.decision_log.conversation_id | conv.conversations | The application (by id) |
The screen
localhost:13301/observe
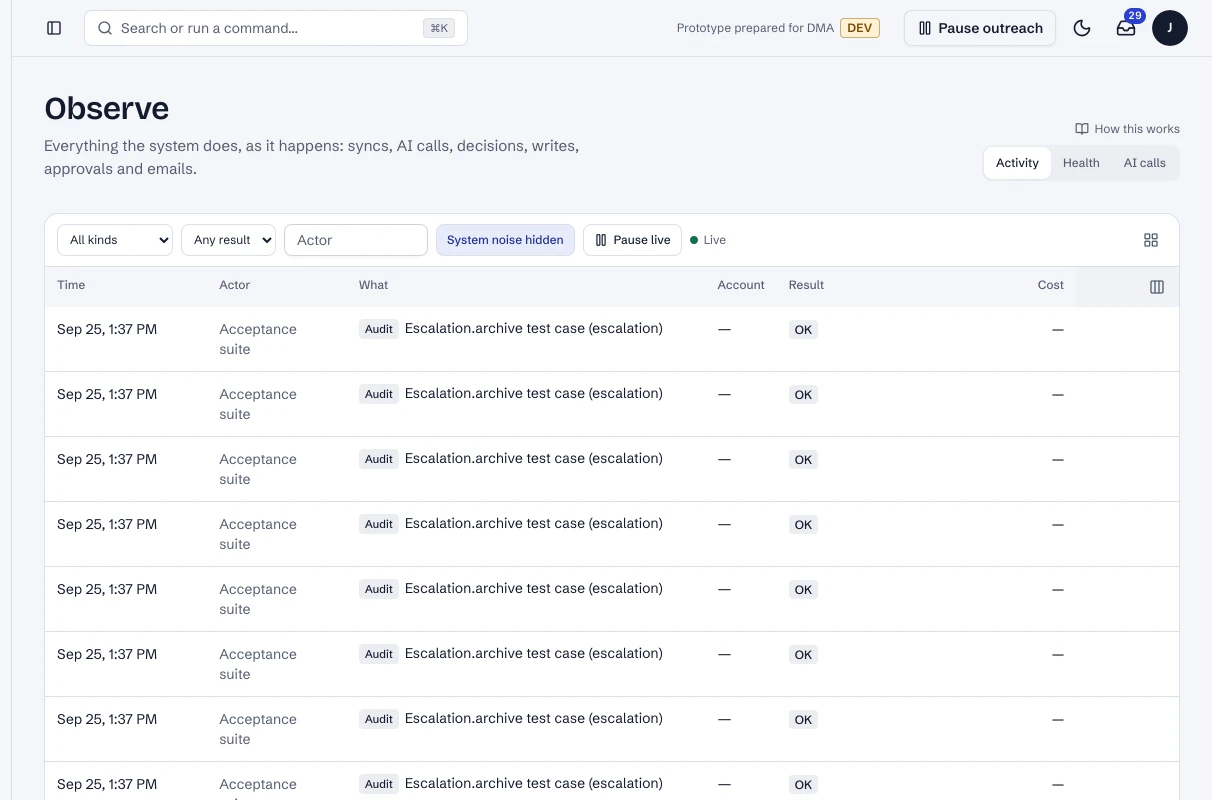
1 / 3Observe: the activity stream, live.
- 1Filter by kind of event.
- 2One event; its trace is one click away.
Dashboard · Observe, live activity. Captured from the running POC on September 25, 2026; synthetic data.
See it live
Opens the screen in the running POC, in a new tab.
| Open | Where | What to try |
|---|---|---|
| Observe | DMA AI dashboard | Chat on the demo site in another window and watch it arrive here. |